🚀 Observability Architecture in Action

🚀 Implemented End-to-End Observability in Spring Boot Microservices
Recently worked on setting up a complete observability stack for Spring Boot applications to improve debugging, monitoring, and system visibility.
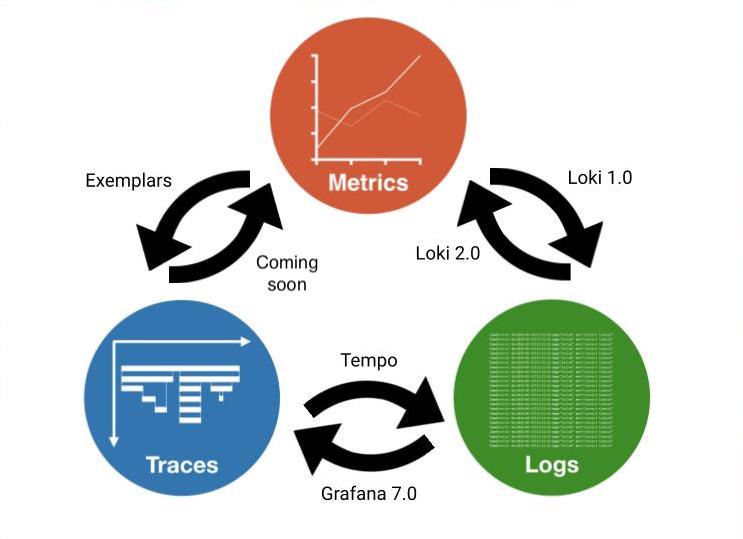
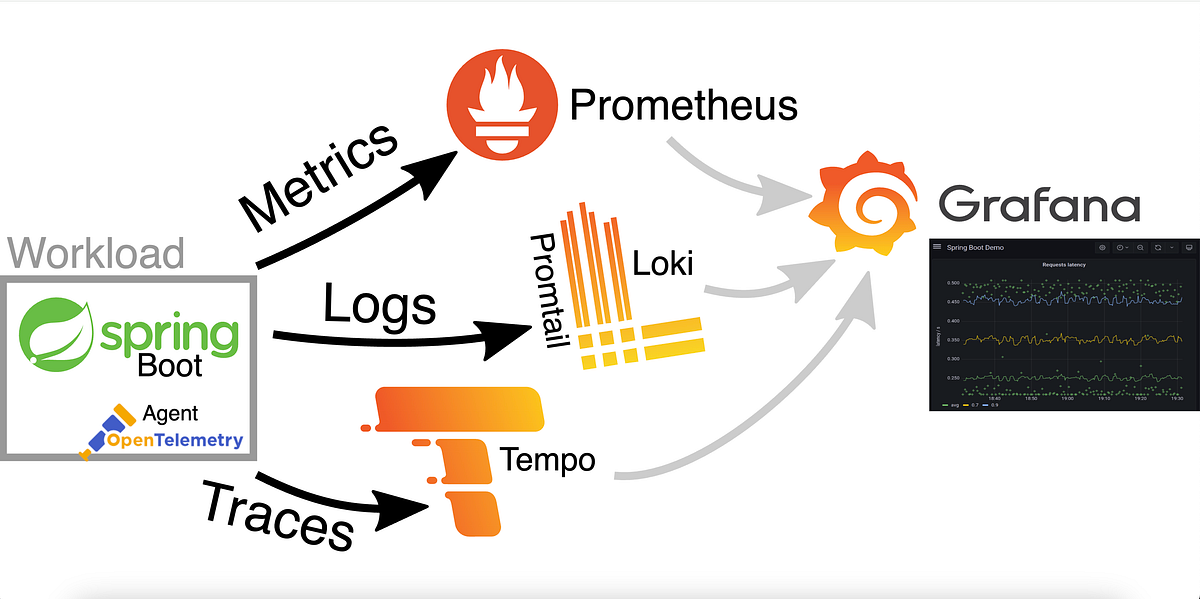
This was focused on integrating the 3 pillars of observability:
👉 Traces 👉 Metrics 👉 Logs
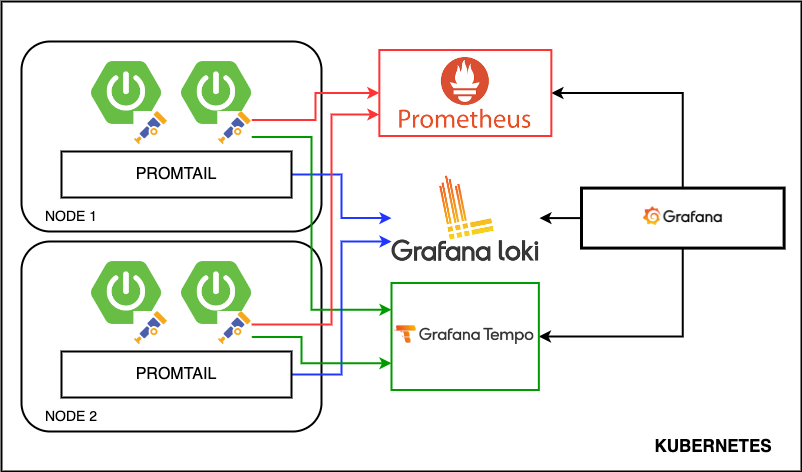
🔹 What I Implemented
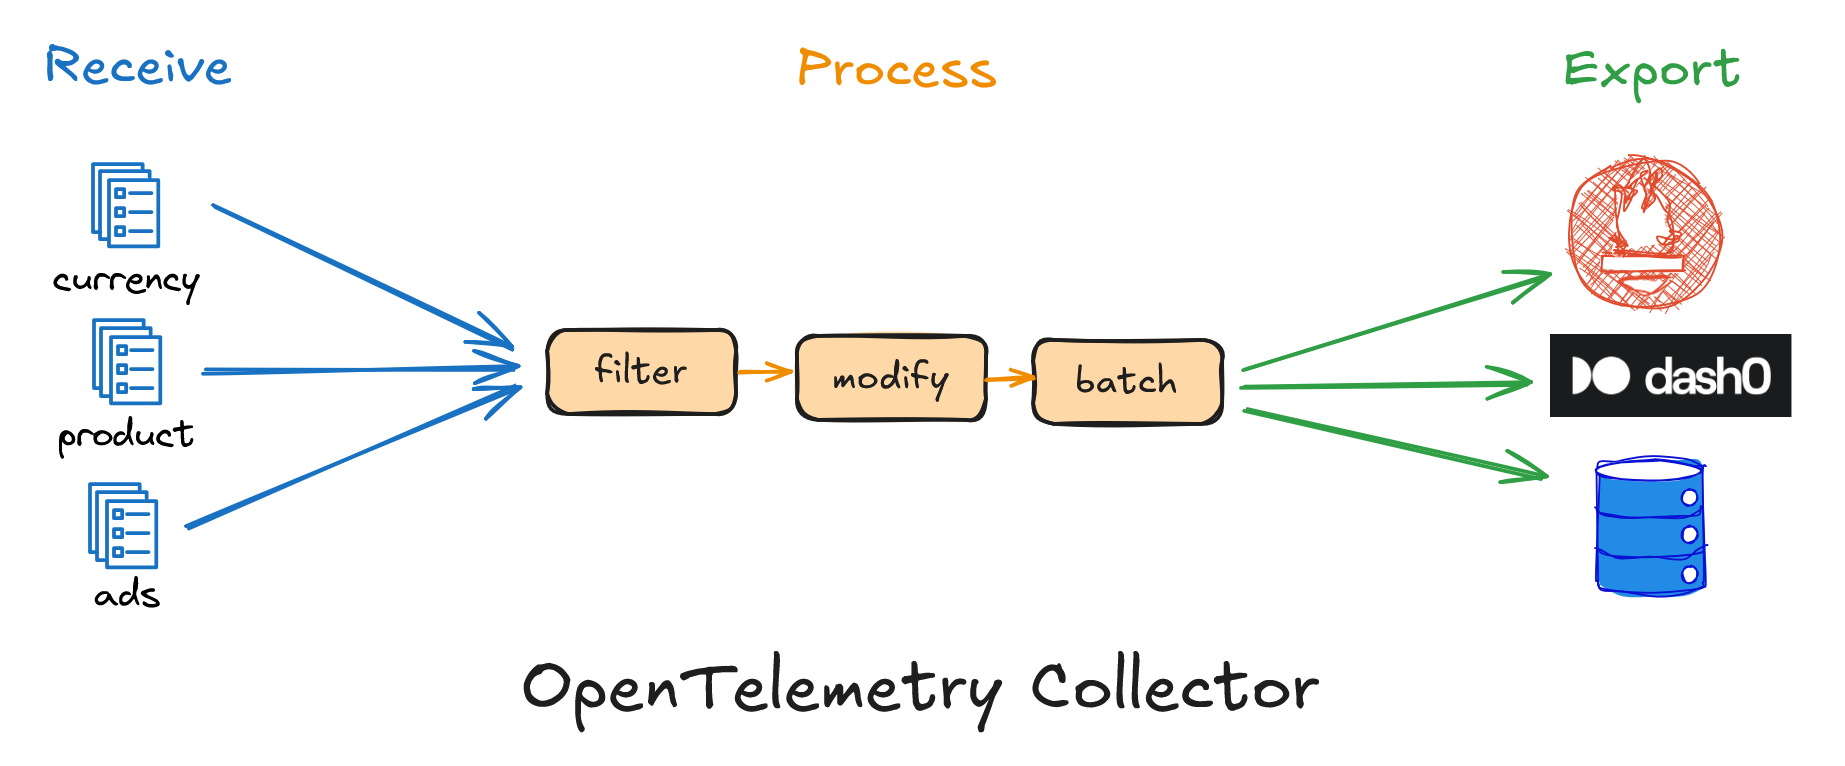
✔️ Zero-code instrumentation using Java agent ✔️ Captured:
- Incoming HTTP requests
- Inter-service communication
- Database queries
- Cache operations
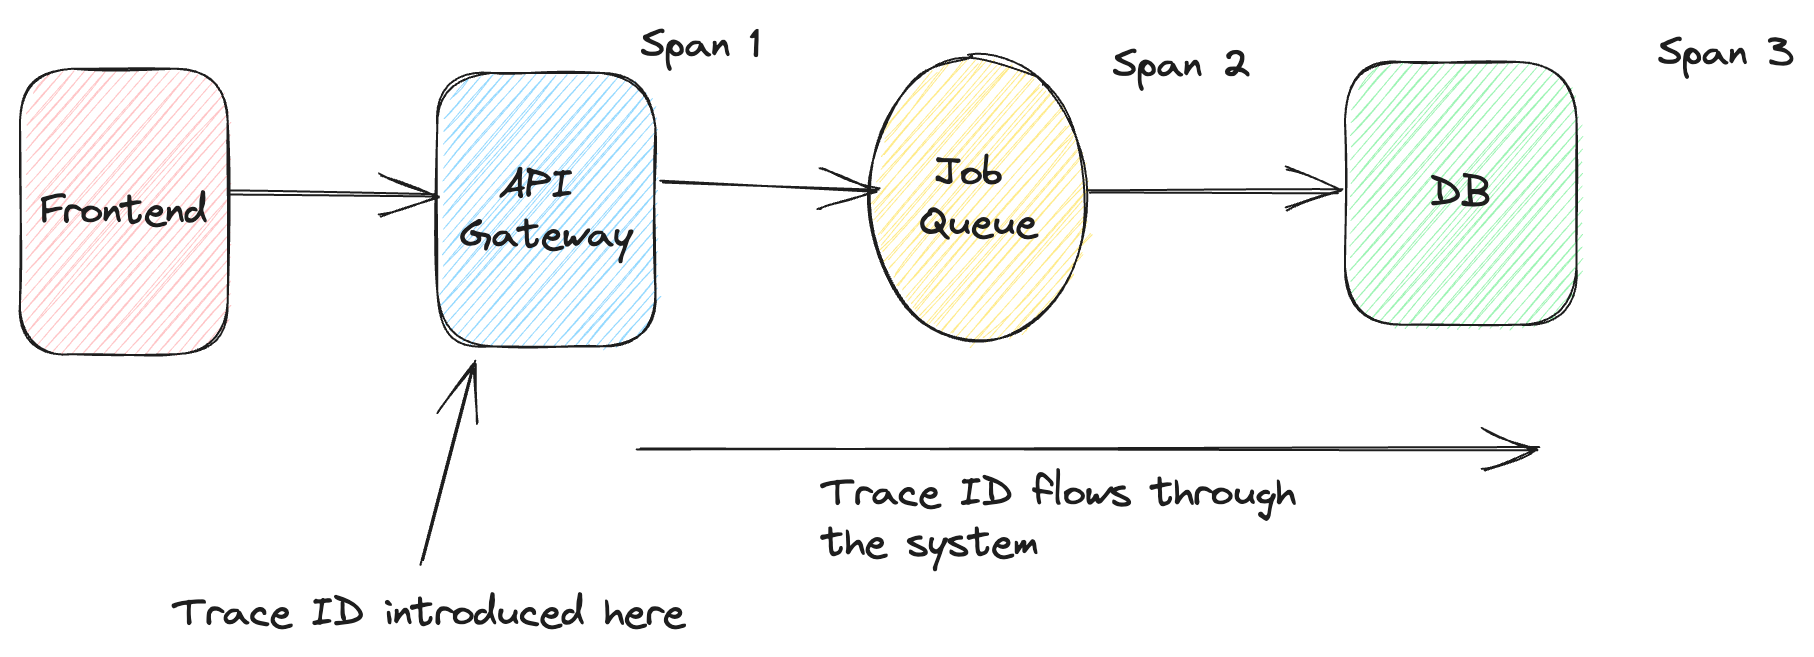
✔️ Every request is tracked using a unique Trace ID
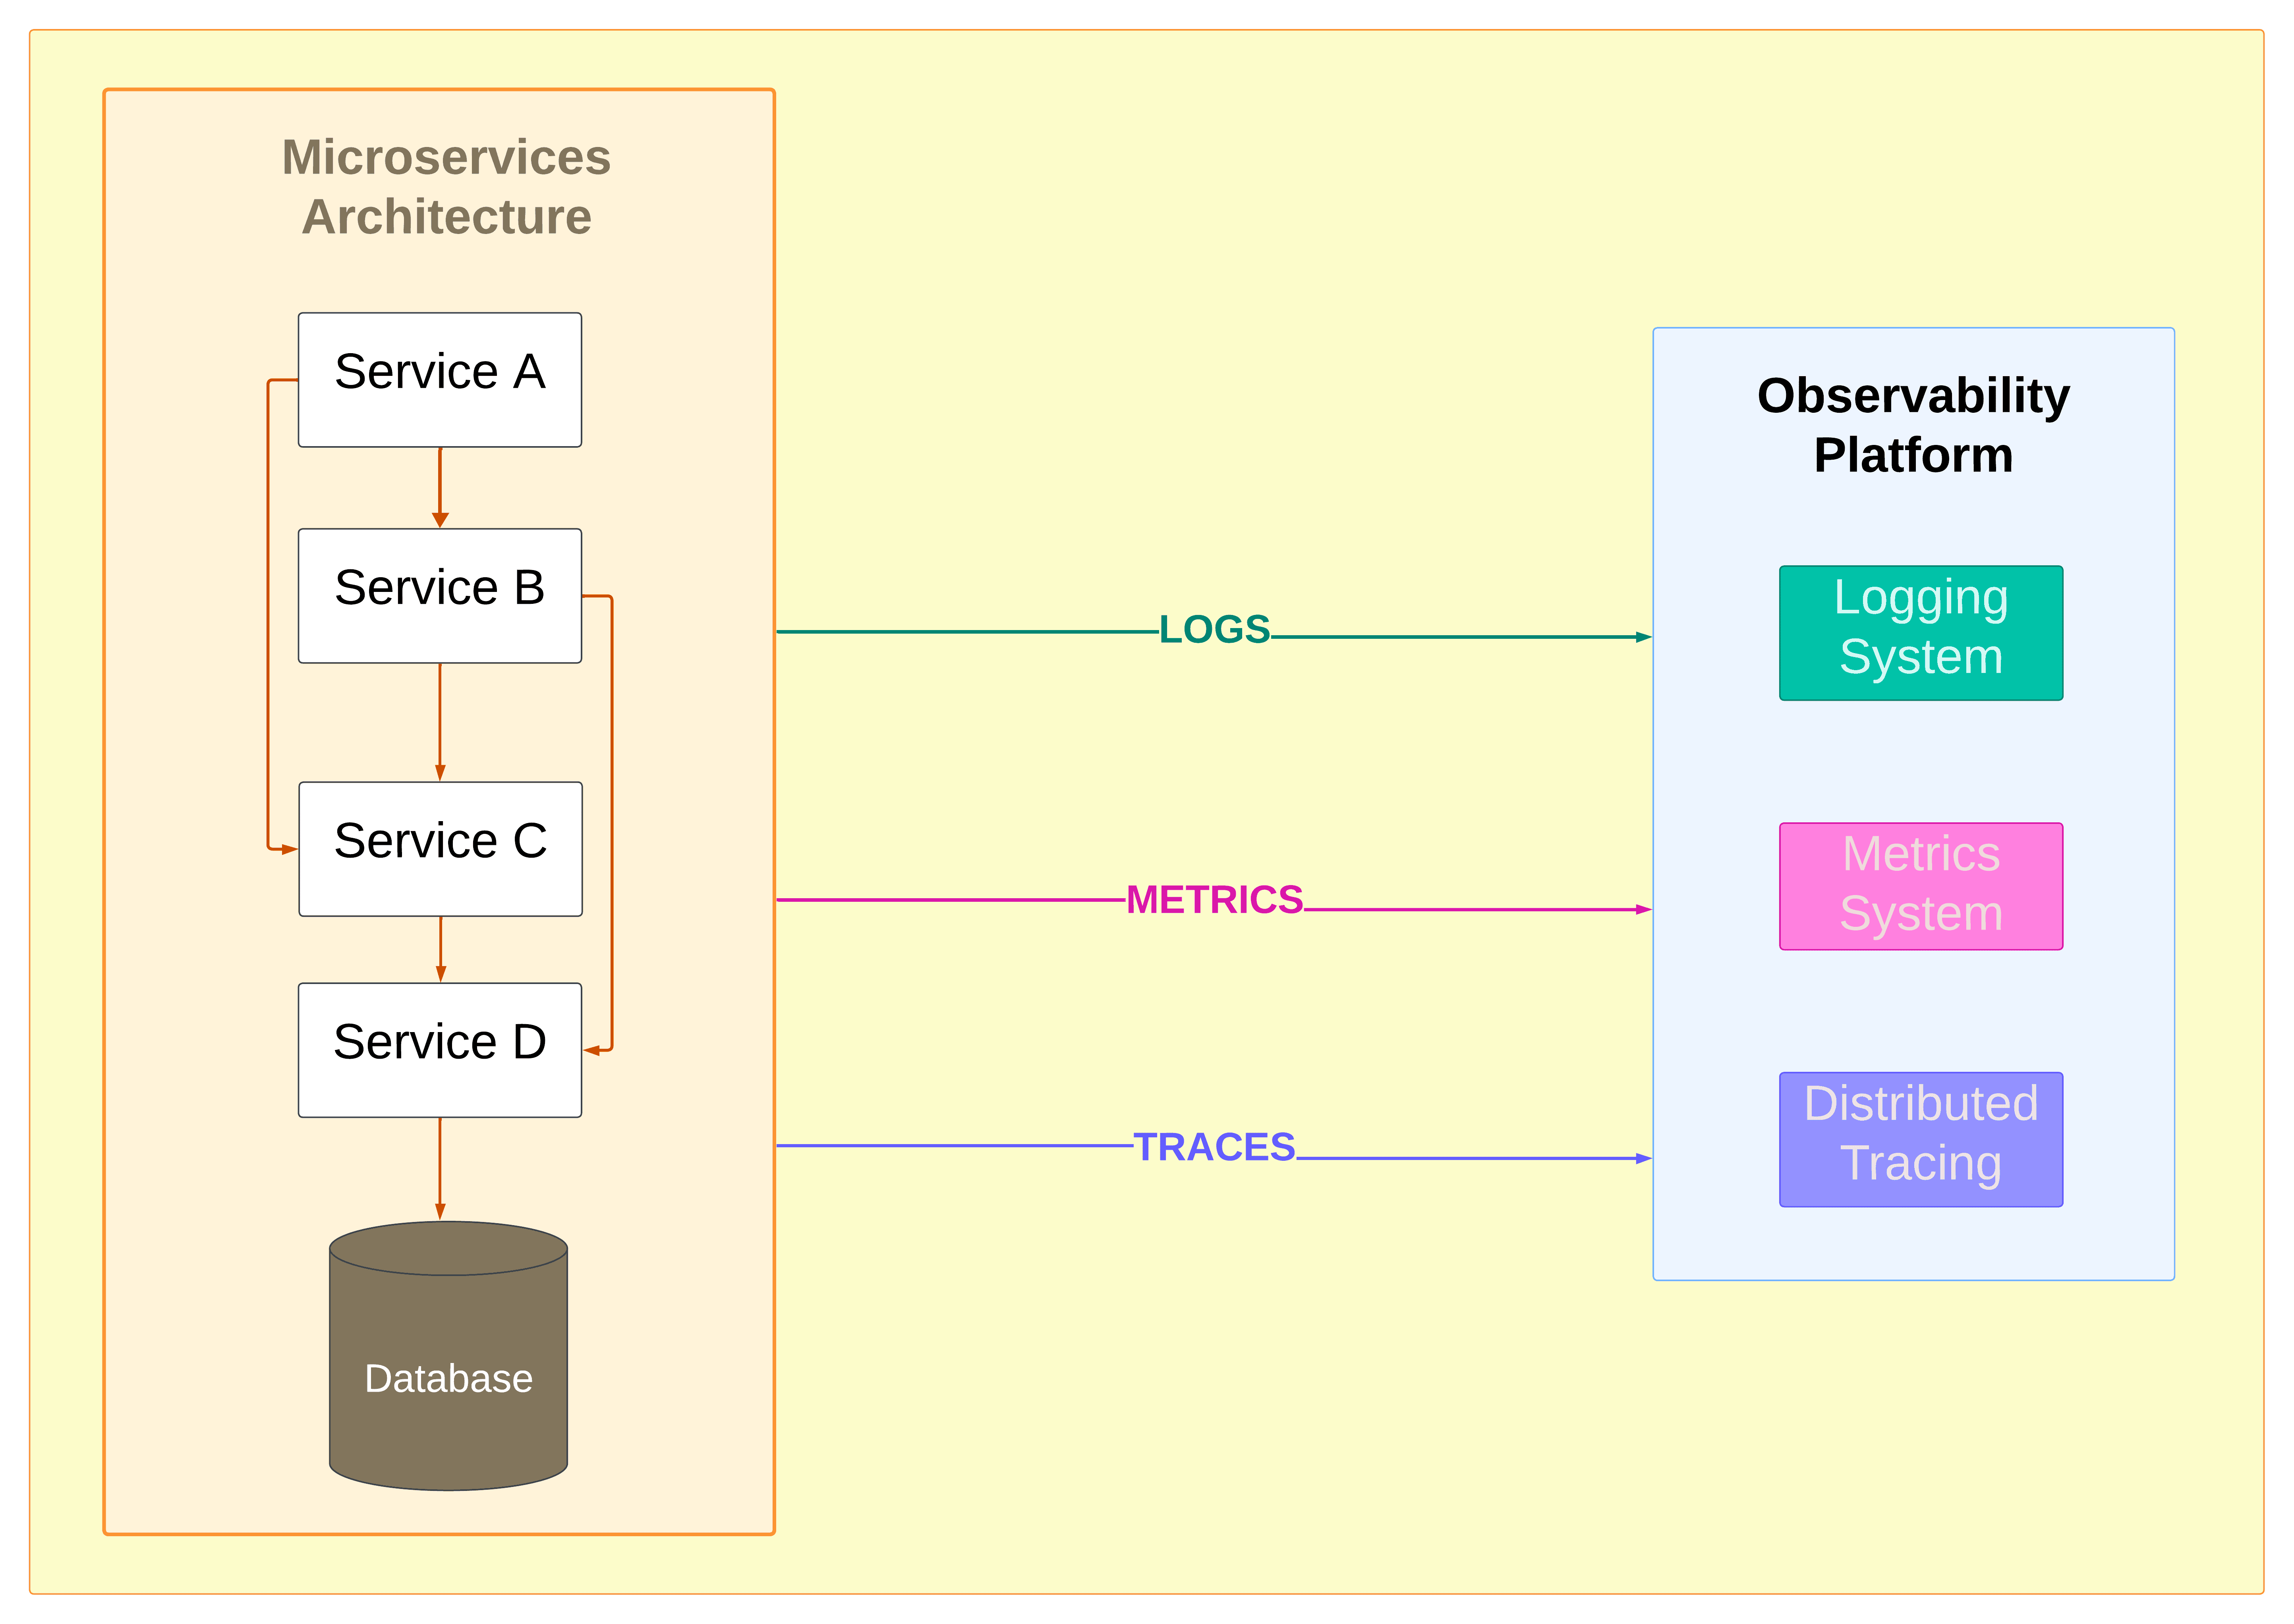
🔹 Distributed Tracing (Real Flow)
One API call flows like this:
Service A → Service B → Service C
All services share the same Trace ID → making debugging super easy
🔹 Centralized Logging
Enhanced logs with:
- trace_id
- span_id
Now logs are directly linked to traces
➡️ No more guessing — exact request tracking possible
🔹 Metrics Monitoring
Exposed metrics endpoint:
/actuator/prometheus
Tracking:
- API latency
- Error rates
- Request count
- JVM health
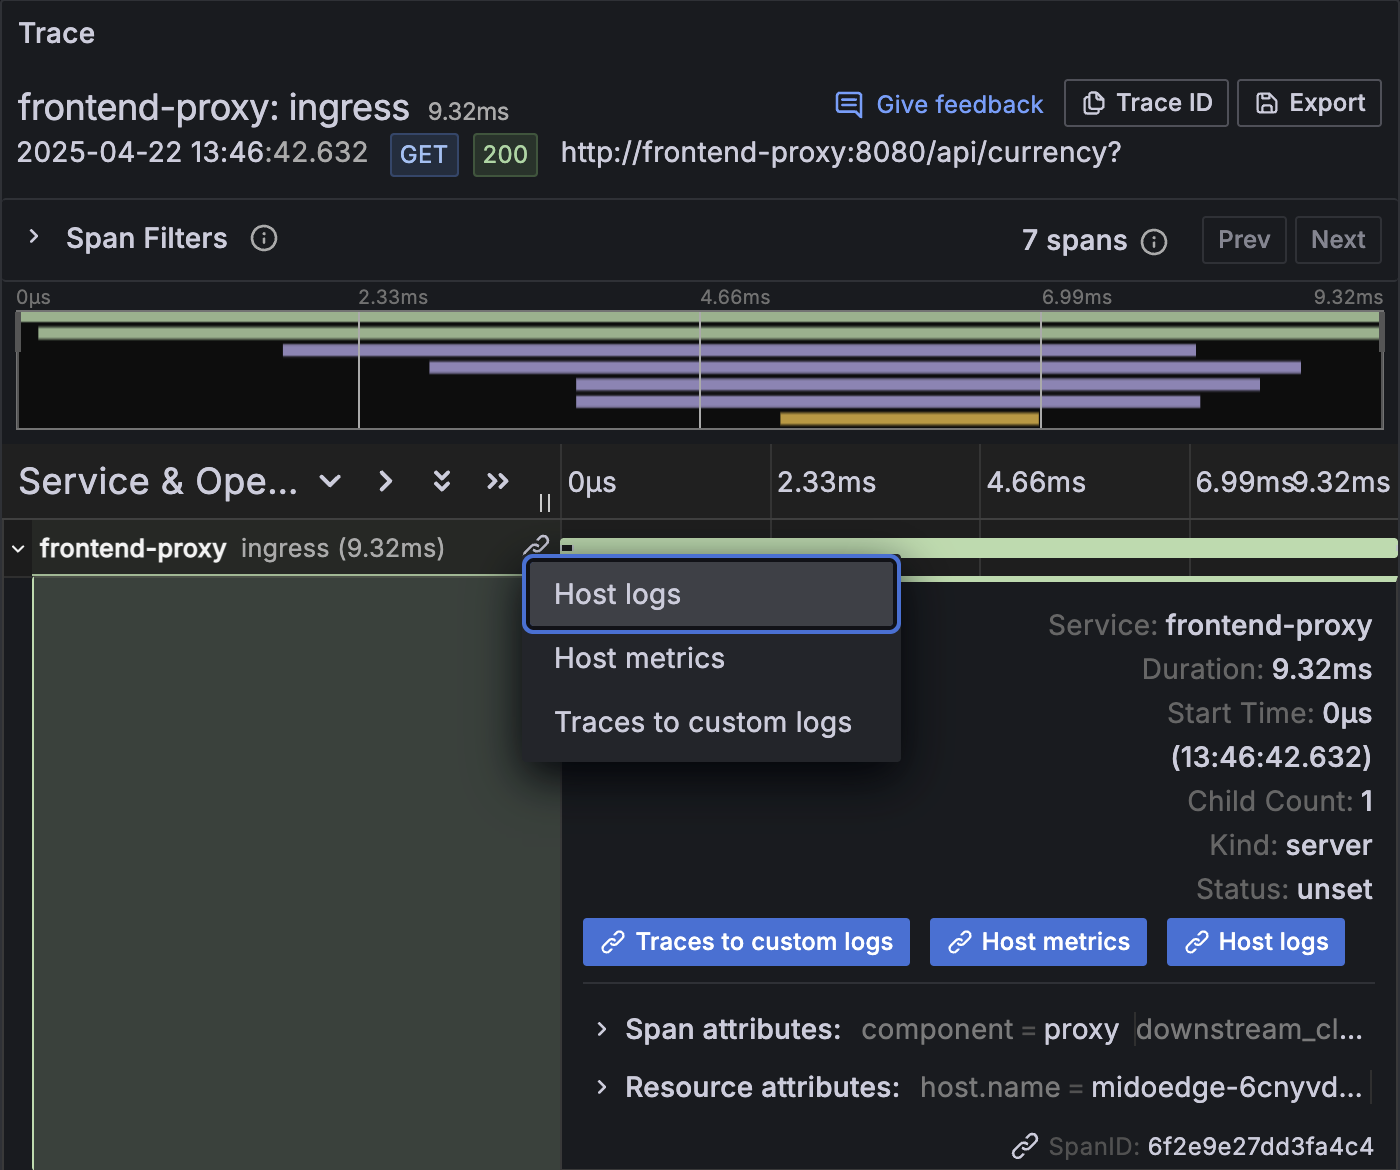
🔹 Powerful Correlation 🔥
This is where things became interesting:
➡️ Metrics → jump to Trace ➡️ Trace → jump to Logs ➡️ Logs → reconstruct full request
Complete visibility in one flow
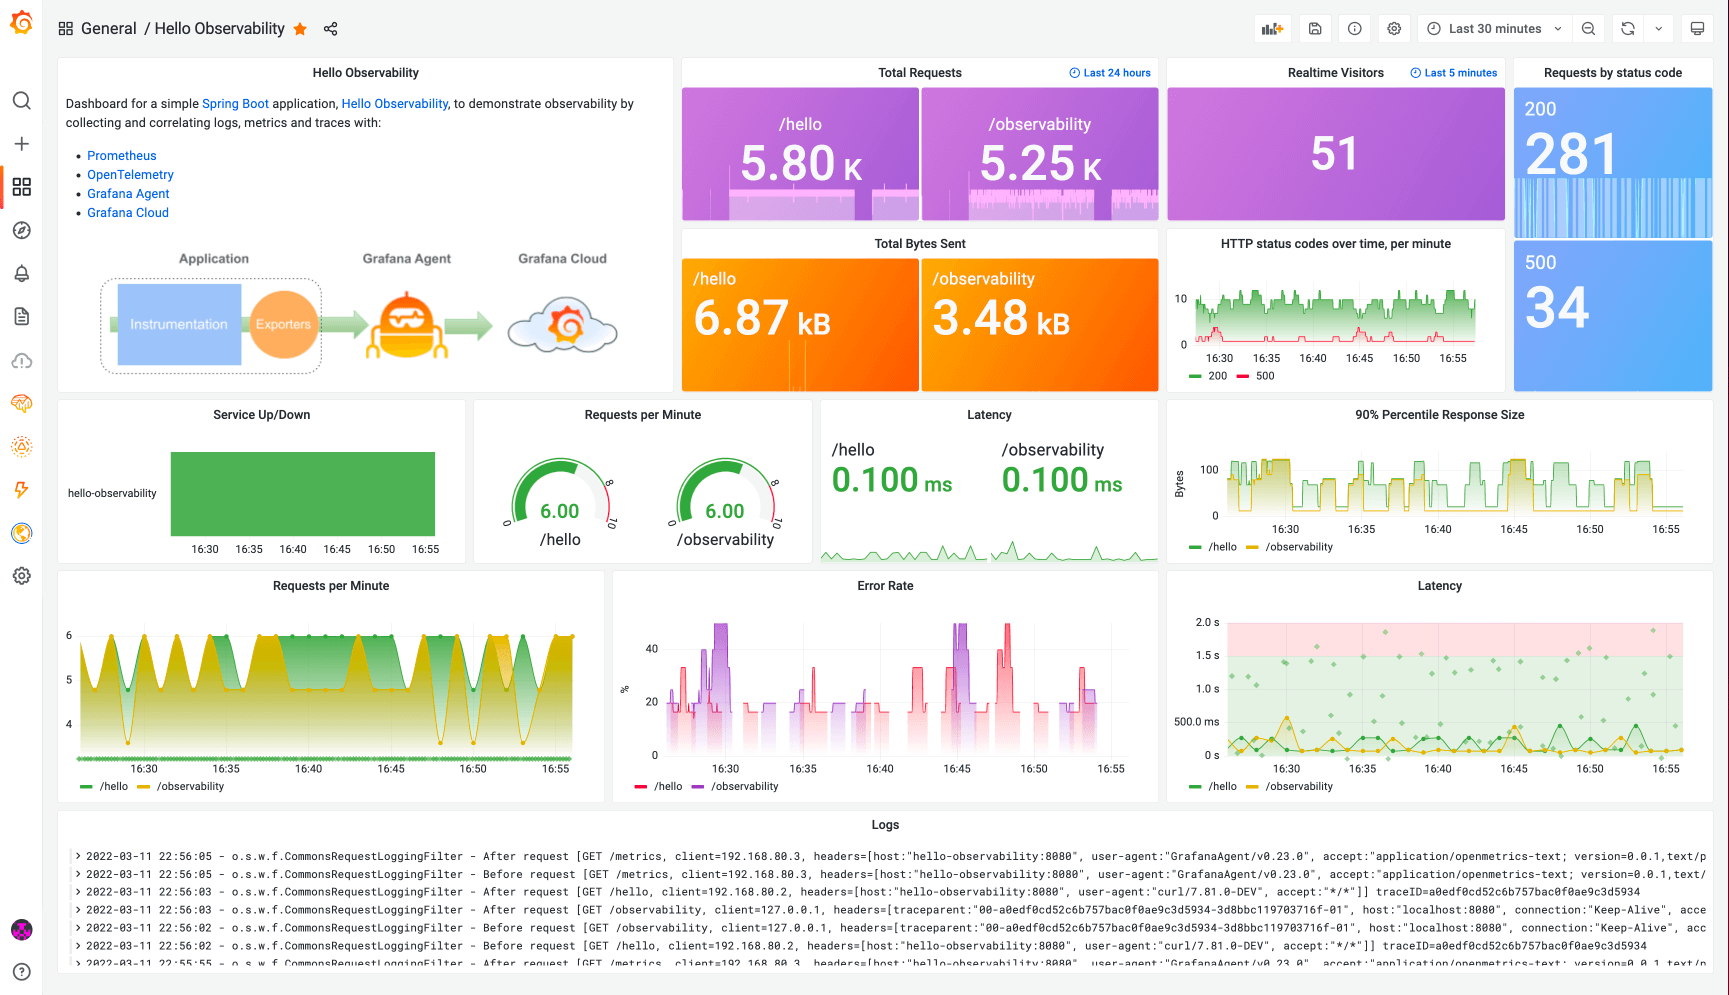
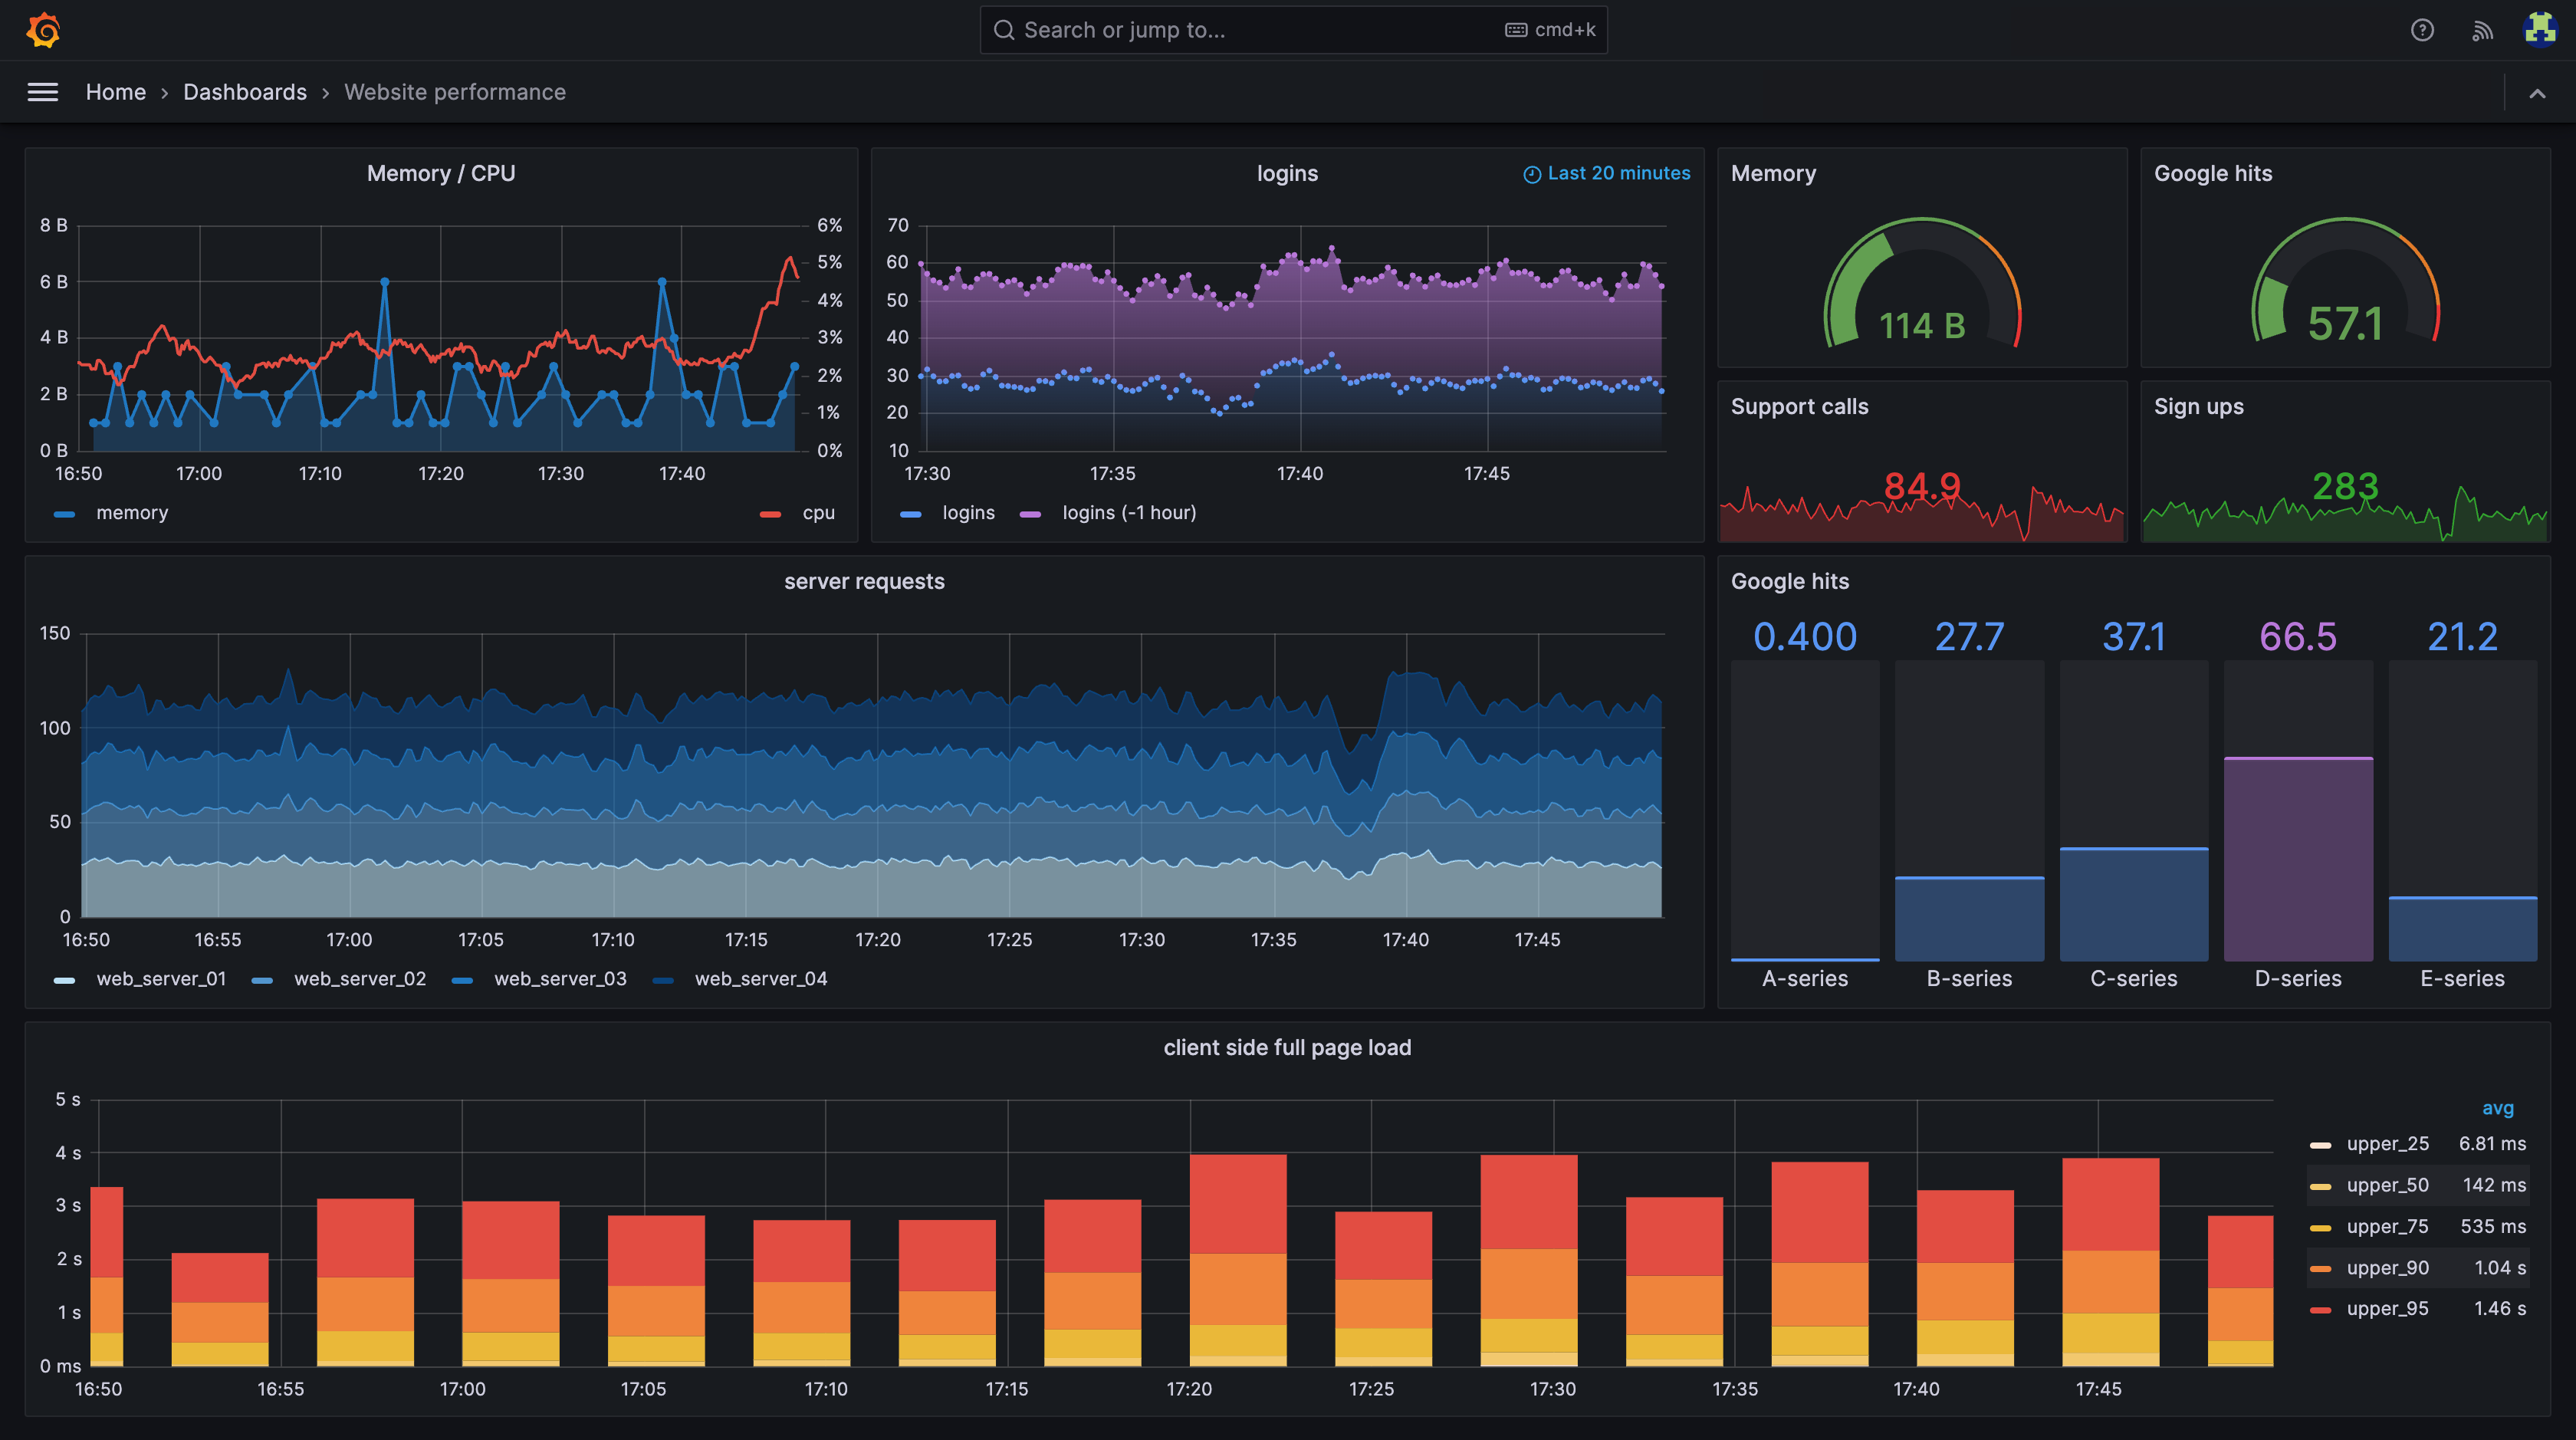
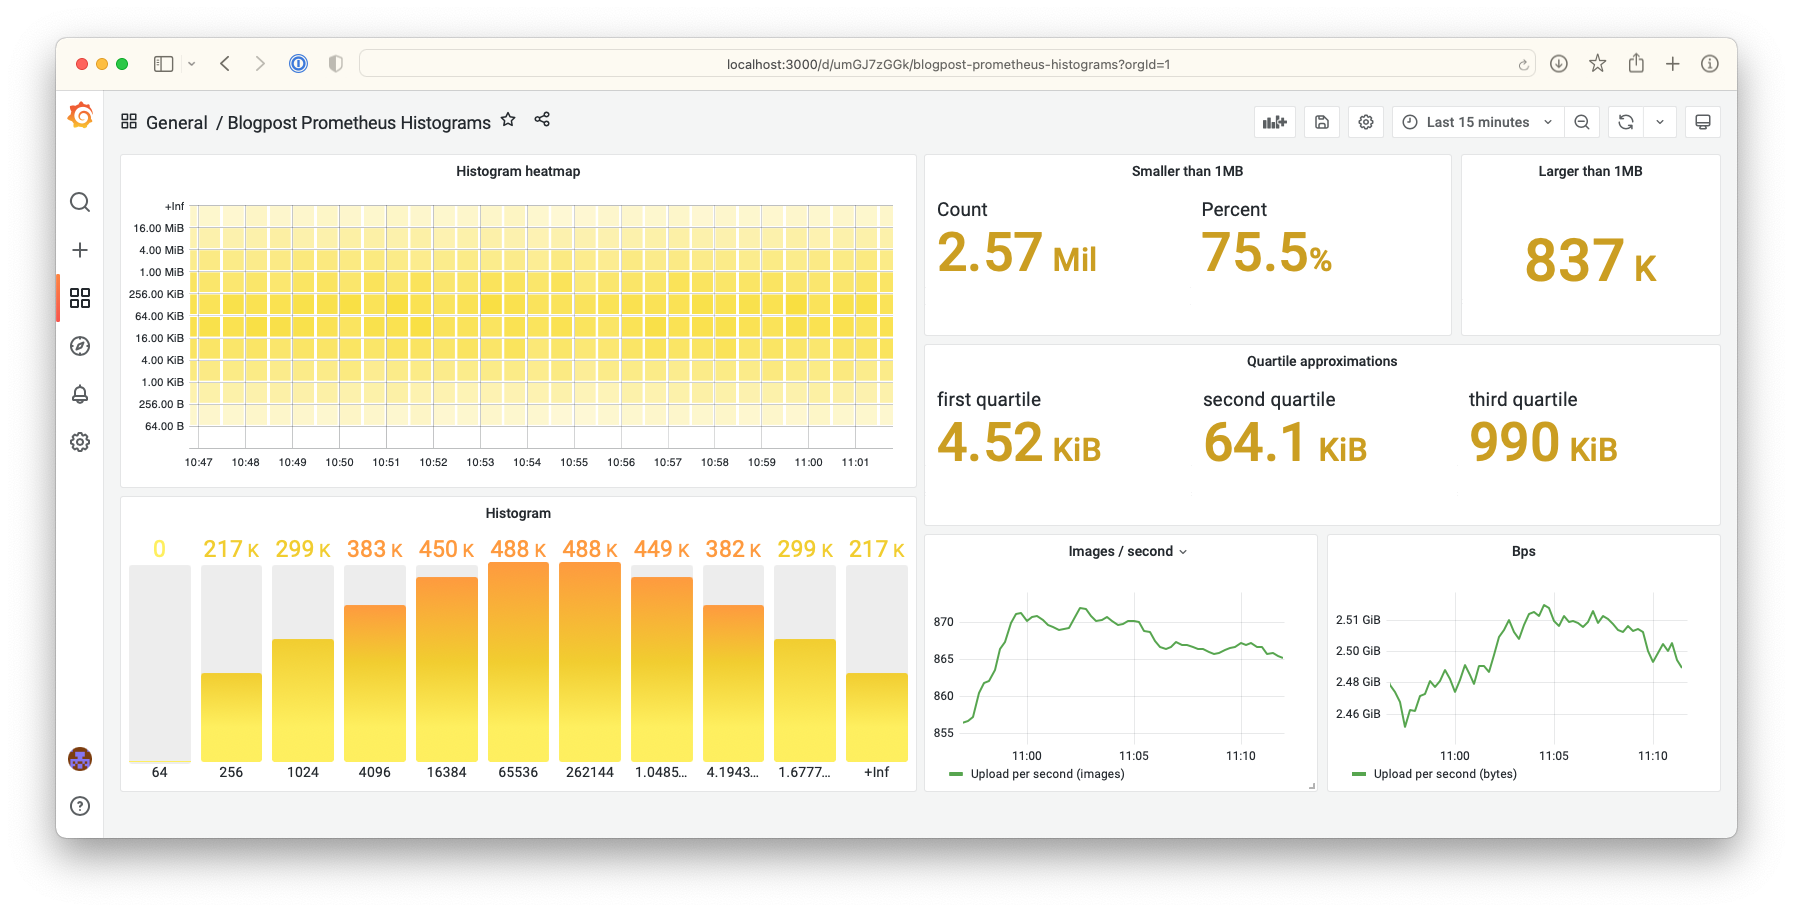
🔹 Dashboard Setup
Created a centralized monitoring dashboard showing:
- Service performance
- Traffic patterns
- Failure rates
Single place to monitor everything
🔹 Impact
✅ Debugging time reduced significantly ✅ Faster root cause analysis ✅ Better production visibility ✅ Proactive monitoring enabled
🔹 Final Thought
Observability is not just monitoring — it's about understanding the complete lifecycle of a request across systems
This setup helped move from reactive debugging → proactive system visibility 🚀
#DevOps #Observability #SpringBoot #Microservices #SRE #Monitoring #Grafana #OpenTelemetry
📊 Dashboard View

🔗 Metrics ↔ Logs ↔ Traces Correlation