🚀 Built this using AWS ECS + ADOT + X-Ray as part of enterprise observability standardization


🚀 Implemented Observability for ECS Microservices using ADOT (AWS Native Stack)
Recently implemented a production-grade observability solution on AWS ECS, aligned with enterprise monitoring standards.
This setup follows the 3 pillars of observability: 👉 Traces 👉 Metrics 👉 Logs
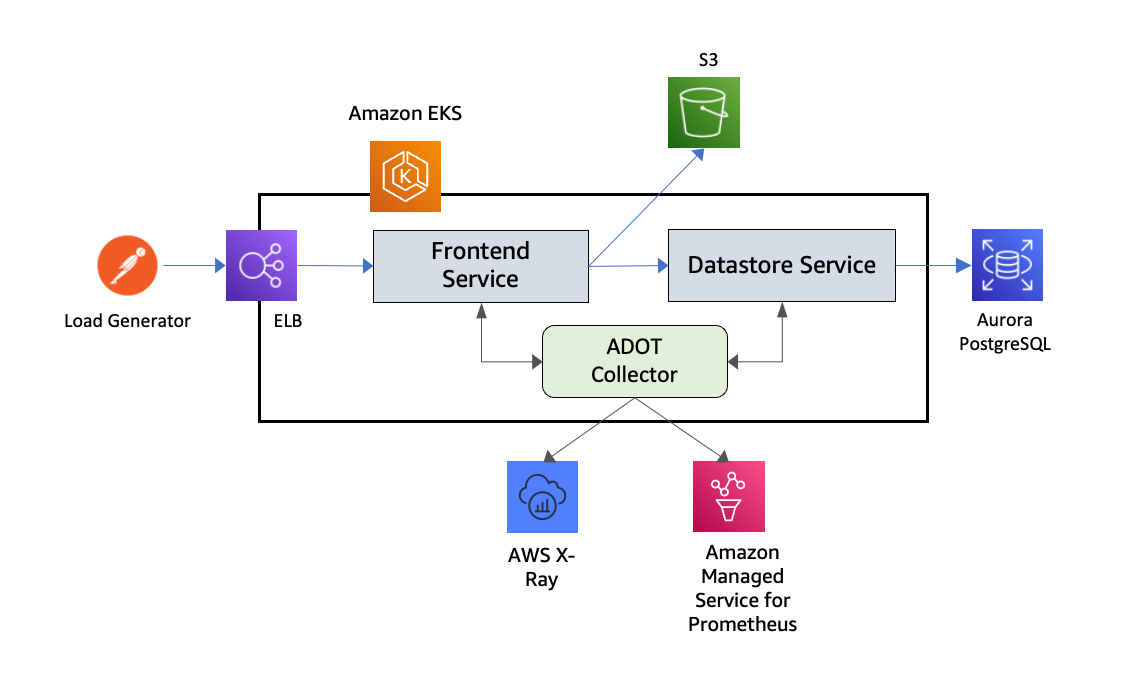
🔹 Step 1: ADOT Collector Deployment (Sidecar Pattern)
Deployed AWS Distro for OpenTelemetry (ADOT) as a dedicated ECS task:
-
Configured OTLP endpoints:
- gRPC → 4317
- HTTP → 4318
-
Enabled resource detection:
- ECS metadata
- EC2 metadata
- Environment variables
📌 Result: Automatic telemetry collection from all containerized services
🔹 Step 2: Tracing with AWS X-Ray
-
Integrated ADOT → AWS X-Ray exporter
-
Captured:
- Service-to-service communication
- API latency
- Dependency mapping
📌 Result: End-to-end request visibility using Trace IDs
🔹 Step 3: Centralized Logging
-
Configured logs to CloudWatch:
- Log Group:
/aws/spans - Stream: Task-based
- Log Group:
-
Structured logs with trace correlation
📌 Result: Logs linked with traces for faster debugging
🔹 Step 4: Metrics Collection (Application Signals)
- Exported metrics using Embedded Metric Format (EMF)
Tracked:
- Latency
- Error rate
- Fault rate
- Success rate
📌 Result: Real-time service performance monitoring
🔹 Step 5: ECS Integration (Container Observability)
-
Enabled ECS-level observability:
- Task-level metrics
- CPU / Memory tracking
- Service health monitoring
📌 Result: Full visibility into container lifecycle and performance
🔹 Step 6: Correlation Across Observability Pillars 🔥
➡️ Metrics → Trace (latency spike → trace root cause) ➡️ Trace → Logs (identify exact failure point) ➡️ Logs → Metrics (detect patterns & anomalies)
📌 Result: Complete end-to-end debugging workflow
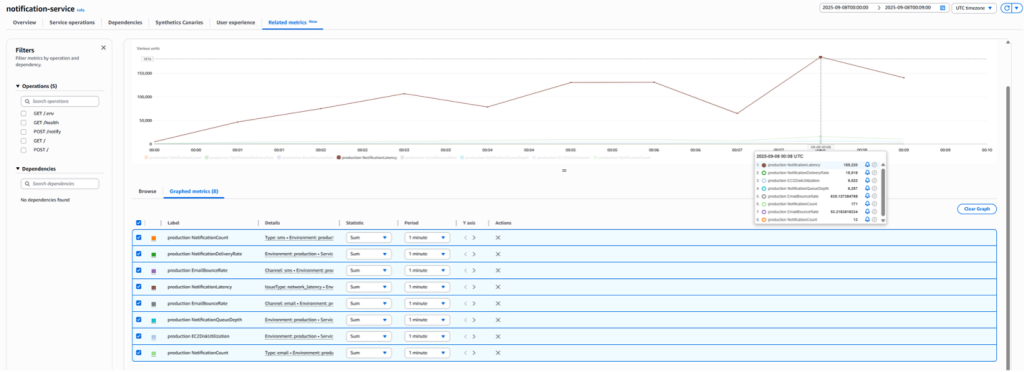
🔹 Step 7: Dashboard & Monitoring
-
Built dashboards tracking:
- Request volume
- Error rates
- Latency (p95/p99)
- Service dependencies
📌 Result: Single-pane-of-glass monitoring for ECS workloads
🔹 Impact
✅ Reduced MTTR (Mean Time to Resolution) ✅ Enabled proactive anomaly detection ✅ Improved system reliability ✅ Achieved deep visibility across microservices
🔹 Final Thought
Observability is not just about monitoring infrastructure — it’s about understanding how requests flow across distributed systems
With ADOT + ECS + AWS-native services, we achieved: 👉 Full traceability 👉 Real-time monitoring 👉 Faster incident resolution
#AWS #ECS #DevOps #Observability #OpenTelemetry #CloudWatch #XRay #Microservices #SRE
📊 ECS Observability Dashboard (Example View)
![]()